There are no items in your cart
Add More
Add More
| Item Details | Price | ||
|---|---|---|---|

When I analyze the data from the research paper by Jacob and Raju (2024), the evidence is crystal clear:
Thu Oct 16, 2025
The Cyclically Adjusted Price-to-Earnings (CAPE) ratio, developed by Nobel laureate Robert Shiller, smooths out business cycle fluctuations by using 10 years of inflation-adjusted earnings. This gives us a clearer picture of market valuations than traditional P/E ratios.
My Investment Prediction from June 9, 2025: As someone who closely tracks market valuations using the Shiller CAPE ratio, I suggested on June 9, 2025 that Indian markets would face corrections soon due to extreme valuations. While markets only fell modestly (-0.62% in one week, -1.53% max drawdown over one month), the correction I predicted is still unfolding.
What is CAPE and Why It Matters
The Cyclically Adjusted Price-to-Earnings (CAPE) ratio, developed by Nobel laureate Robert Shiller, smooths out business cycle fluctuations by using 10 years of inflation-adjusted earnings. This gives us a clearer picture of market valuations than traditional P/E ratios.
Key CAPE Insights for India:
Historical Evidence: High CAPE = Poor Returns
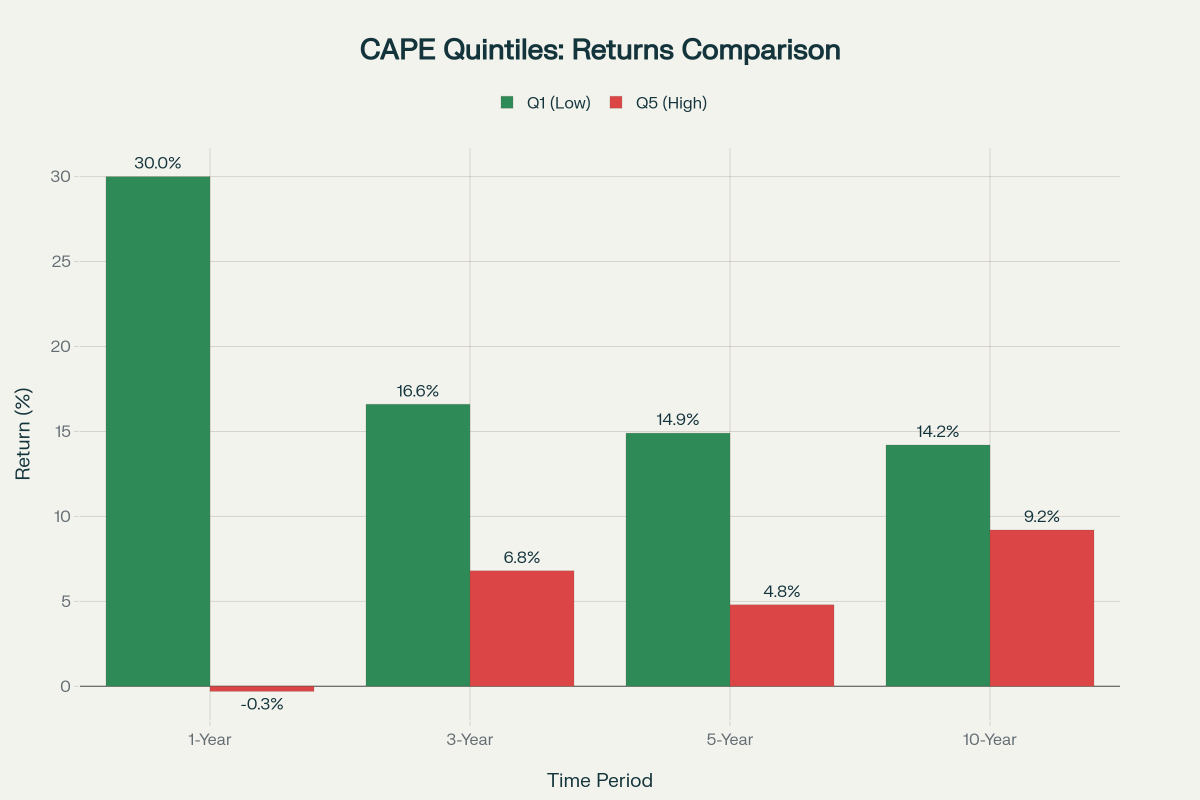
When I analyze the data from the research paper by Jacob and Raju (2024), the evidence is crystal clear:
Returns by CAPE Quintiles (Nifty 100):
Risk Increases Dramatically:
Historical relationship between CAPE levels and Indian market performance showing returns and drawdowns
Historical relationship between CAPE levels and Indian market performance showing returns and drawdowns CAPE and Market Movement Correlation Below is the historical relationship between NIFTY index movements and CAPE valuations from 2006 to 2024. Notice how the three major CAPE peaks (2008, 2015, and 2024) corresponded with subsequent market corrections or periods of subdued returns.
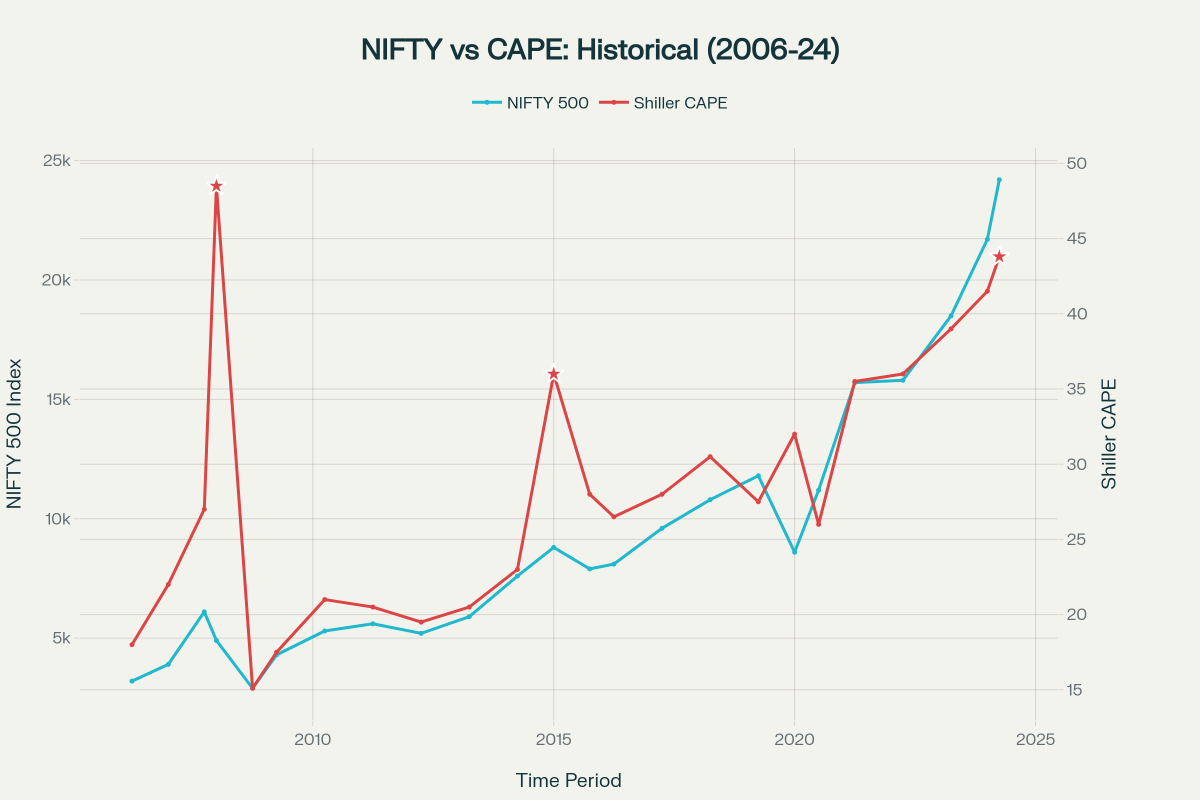
Historical comparison of NIFTY 50 Index movements with Shiller CAPE ratio showing valuation extremes and subsequent market corrections AI Bubble and Global Factors The current Indian market situation mirrors global concerns about an AI investment bubble:
The October 2025 $19 billion crypto crash demonstrates interconnected risks:
Based on historical patterns and current valuations, here's how I would approach the market like Warren Buffett:
1. Reduce Equity Exposure

Gikson George
Trader and Mentor
 Launch your Graphy